Paid Marketing Tableau Dashboard

NOTE***: Certain information has been redacted/changed to protect proprietary information
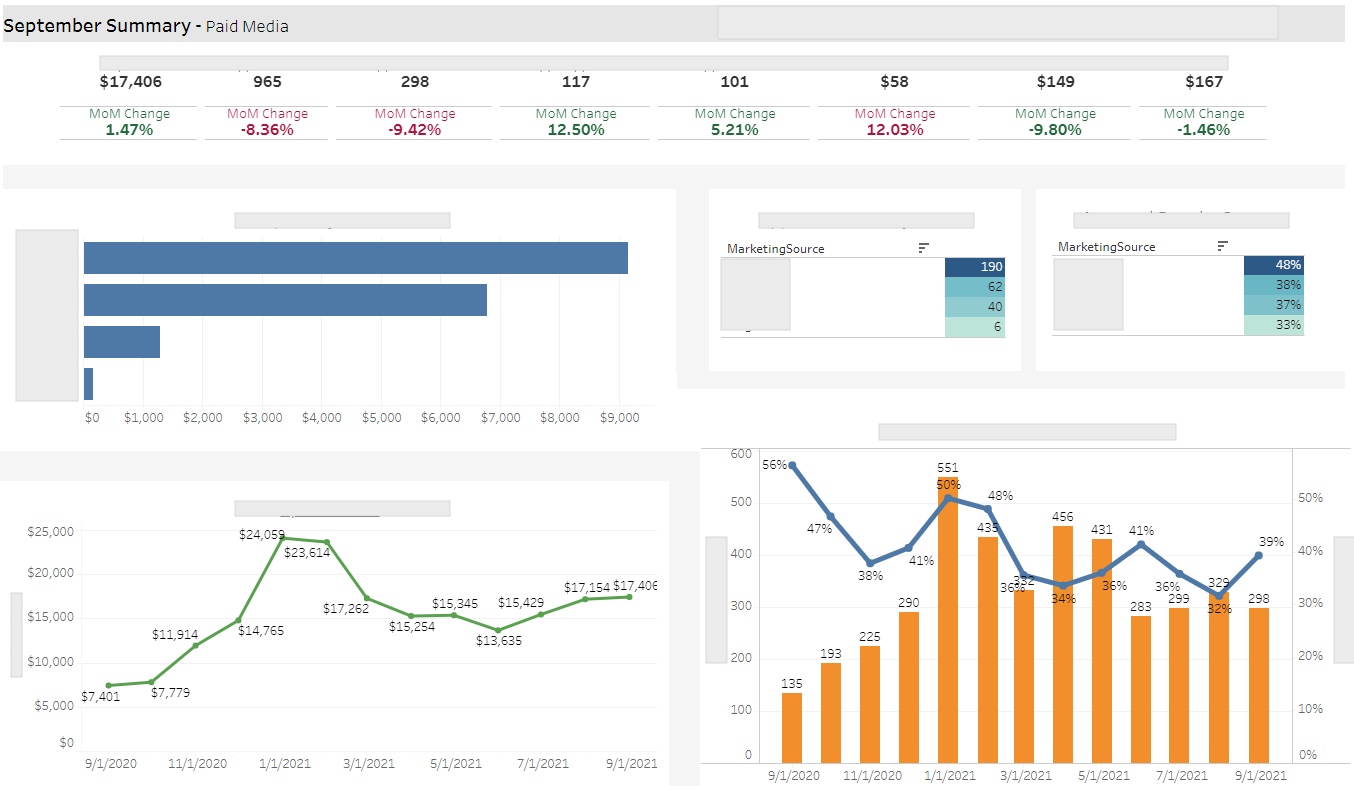
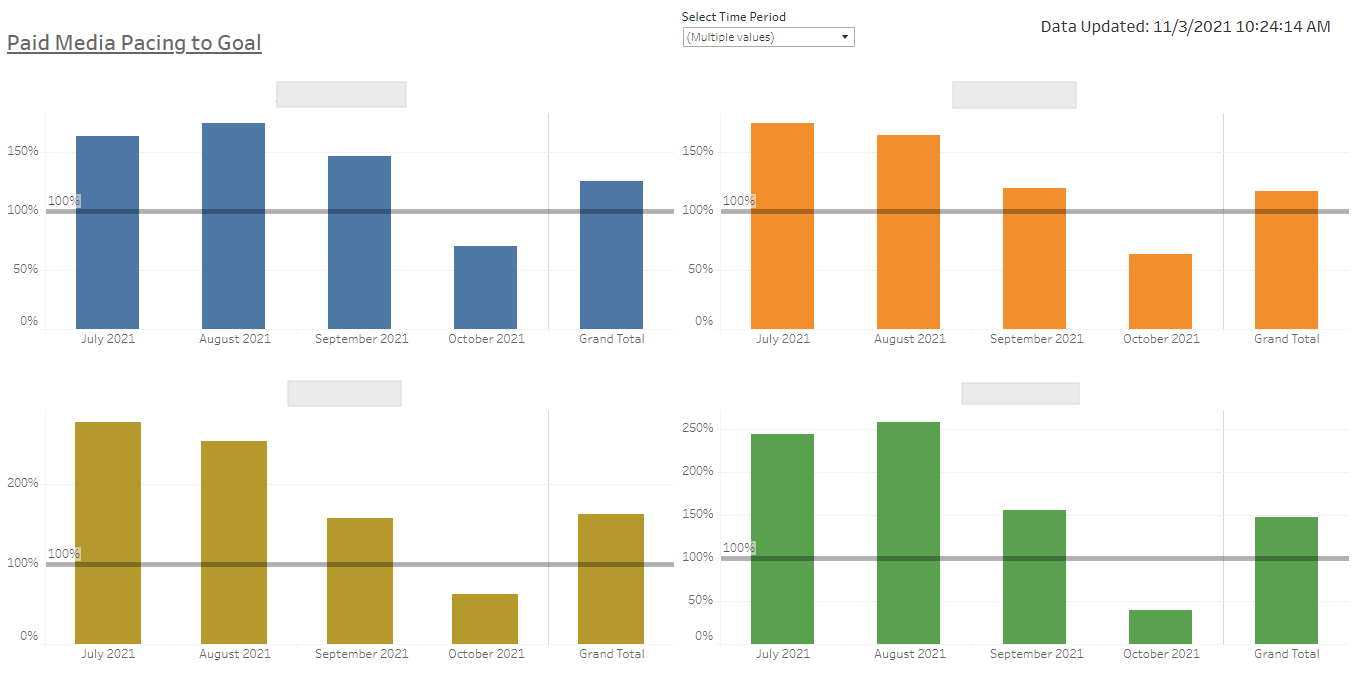
At a previous role, I migrated the marketing team’s paid platform reporting (Google Ads. Facebook Ads etc.) from Excel to Tableau. This reduced manual reporting by hours each week, and made reporting self-serve and near real-time.
While getting up to speed in my position as an analyst, I had noticed that the reporting process for paid media was a cumbersome process. It involved logging into individual platforms and manually copy and pasting the data into an Excel sheet. Not only did this take time and introduced human error, it made analyzing and monitoring metrics fragmented & slow, since data was updated manually on an infrequent basis.
To solve for this, I used ETL tool Panoply, which allowed for connecting to various data sources (such as Google and Facebook Ads) and importing the data to Tableau. While Panoply made the Extract aspect easy, the data being extracted wasn’t perfect, so I implemented a Transform layer using the tool to ensure data integrity. Once transformed, Tableau Prep Builder was crucial in performing final aggregations and job scheduling to ensure data was uniform and updated regularly.
With this back-end work done, I created an automated Tableau report across all of our paid media sources, allowing for self-serve and real-time reporting. See below for some example dashboard views from this project!